Executive Summary:
In today's competitive SaaS landscape, understanding your buyer's journey isn't optional—it's essential for survival. Your website visitors represent real humans with specific needs at different decision stages. Without mapping content to these stages, you're essentially navigating blindfolded, missing countless opportunities to connect and convert.
Key Findings
- Human-Centered Analytics Transform Results: Companies that map content to emotional stages of the buyer's journey see dramatically higher conversion rates than those using generic funnels.
- GA4 Provides Unprecedented Insight: Google Analytics 4's event-based model enables tracking of specific user actions that indicate progression through your sales funnel, revealing previously hidden patterns.
- Parameter-Rich Events Drive Strategic Decisions: Capturing contextual data (source, content type, user segment) with each event allows for precise optimization of marketing resources.
- BigQuery Integration Enables Predictive Modeling: Advanced integration capabilities allow sophisticated analysis of historical patterns to forecast future performance and identify leading indicators of conversion.
- Dashboard Visualization Activates Insights: Custom dashboards highlighting key metrics (channel performance, content engagement, segment conversion) make data accessible and actionable for all stakeholders.
The difference between average and exceptional SaaS performance often lies not in the product itself but in how effectively you guide prospects through their buying journey—meeting them with exactly what they need, precisely when they need it.
Beyond Numbers - The Human Story Behind Your Funnel
Every click, every page view, every form submission represents a human being with real needs, frustrations, and aspirations. In today's hyper-competitive SaaS landscape, understanding the emotional journey of your prospects isn't just helpful—it's the difference between thriving and merely surviving.
Why does mapping your buyer's journey truly matter? Because when prospects feel understood at each stage of their journey, magic happens. Trust forms. Connections deepen. Barriers dissolve.
The most successful SaaS companies don't just build products—they create experiences that resonate with the core emotional needs of their users:
- The product manager desperately trying to prove ROI to skeptical executives
- The marketer overwhelmed by disconnected data points and incomplete stories
- The operations leader seeking certainty in a sea of conflicting priorities
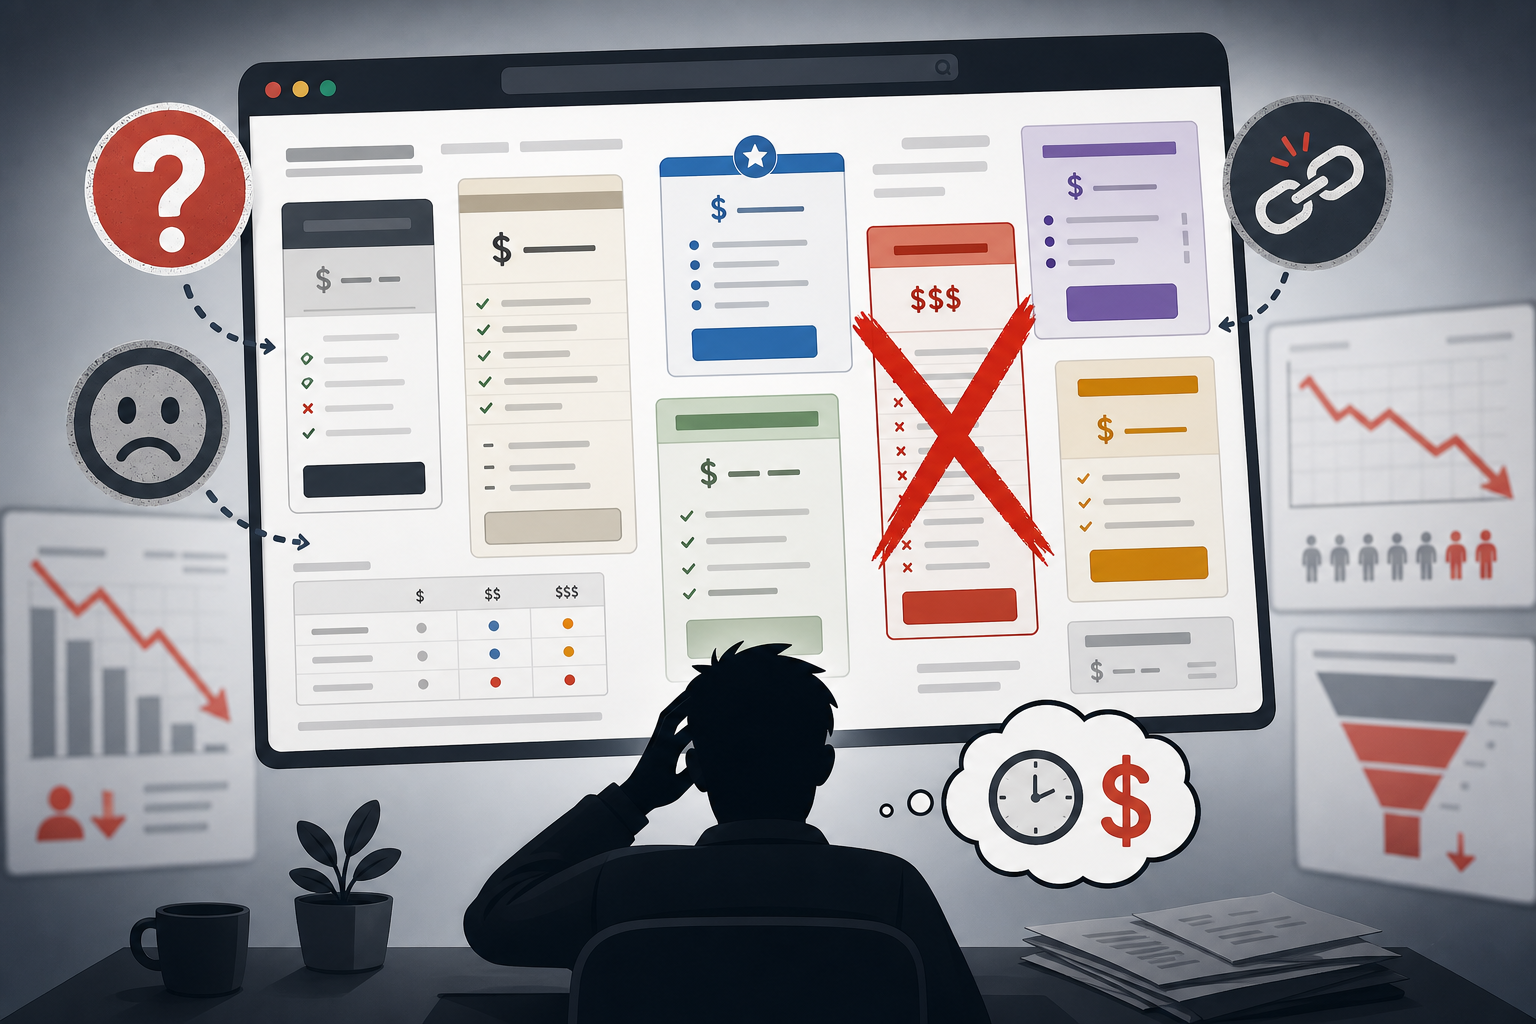
Without mapping content to your buyer's journey, you're essentially navigating blindfolded—making decisions based on intuition rather than evidence, speaking in generalities rather than addressing specific pain points, and ultimately missing countless opportunities to connect meaningfully with potential customers.
When you truly understand not just what pages users visit but why certain content resonates at specific moments in their decision process, you transform your website from a passive information repository into a dynamic conversion engine that feels almost prescient in its ability to deliver exactly what each visitor needs precisely when they need it.
This isn't just about optimizing a funnel. It's about honoring the human experience behind every interaction with your brand.
Using Google Analytics 4 to Collect Critical Historical Funnel Performance Data
Setting Up GA4 for Comprehensive Funnel Data Collection
1. Define Your Funnel Stages as Events
How can we translate our marketing and sales stages into trackable digital events?
GA4 uses an event-based model, making it essential to define key funnel stages as events:
- Configure standard events for common actions: page_view, scroll, click, file_download, form_submit
- Create custom events for business-specific actions: pricing_viewed, feature_explored, case_study_read
- Implement conversion events for key goals: lead_captured, demo_requested, trial_started
Implementation Code Example:
javascript
// Custom event for middle-funnel activity
gtag('event', 'feature_explored', {
  'feature_name': 'analytics_dashboard',
  'user_segment': 'marketing_professional',
  'time_spent': 75
});
2. Establish Parameter-Rich Events for Deeper Analysis
What additional context should we capture about each event to enable more meaningful analysis?
Event parameters provide dimensional data that makes historical analysis more valuable:
- Add source/medium parameters to understand channel effectiveness
- Include content identifiers to track which specific assets drive progression
- Capture user segment information to analyze persona-based journey differences
- Track timestamp data to analyze time-based patterns and velocity
Implementation Code Example:
javascript
// Parameter-rich conversion event
gtag('event', 'demo_requested', {
  'source': 'email_campaign',
  'campaign_id': 'q2_nurture_sequence',
  'previous_page': '/features/enterprise',
  'form_completion_time': 65,
  'lead_score': 85
});
3. Create Custom Dimensions for Cohort Analysis
How can we group users to compare performance across different segments over time?
Custom dimensions allow for powerful segmentation of your historical data:
- Create user-scoped dimensions for demographic or firmographic data
- Establish session-scoped dimensions for contextual visit information
- Develop event-scoped dimensions for specific interaction details
- Set up item-scoped dimensions for product or content attributes
GA4 Interface Steps:
- Navigate to Configure > Custom Definitions
- Click "Create Custom Dimension"
- Name your dimension (e.g., "Lead Source" or "Customer Segment")
- Select the appropriate scope (User, Session, or Event)
- Choose the event parameter to use as the dimension source
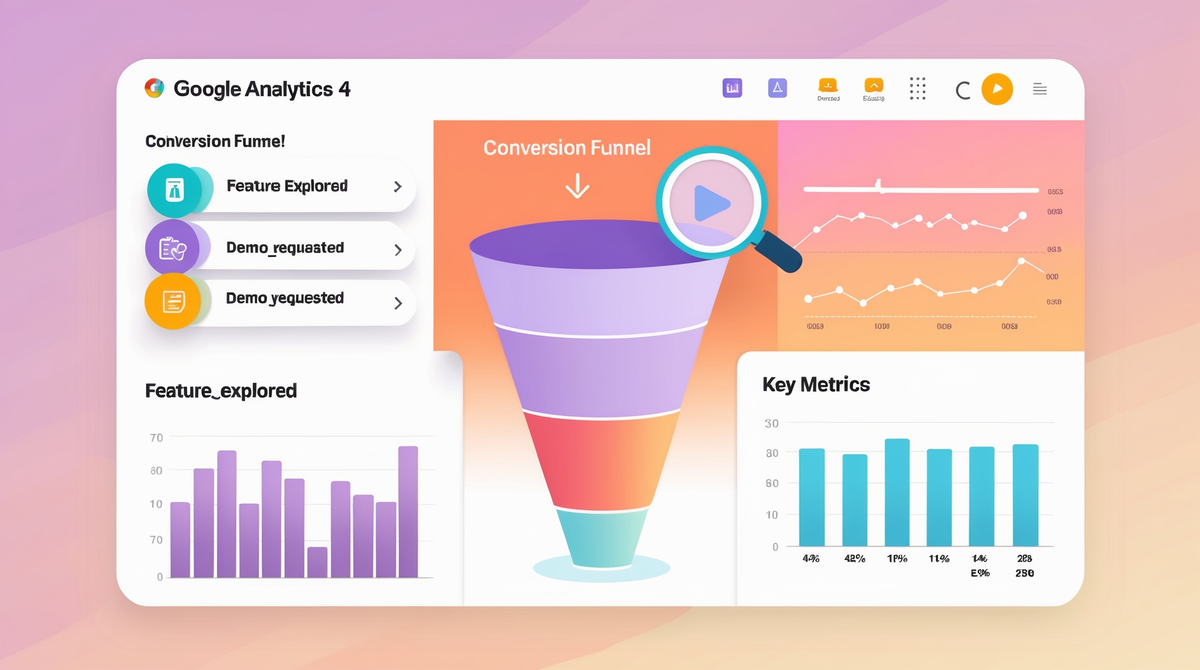
4. Configure Funnel Exploration Reports
How can we visualize the sequential progression of users through our defined funnel stages?
GA4's Exploration reports allow you to create visualizations of your historical funnel data:
- Open Explore > Funnel Exploration
- Add your sequence of funnel steps using defined events
- Set appropriate time frames for your sales cycle
- Compare segments side-by-side to identify performance differences
- Analyze step-by-step conversion rates and drop-offs
Report Configuration Tips:
- Include all potential paths, not just the "ideal" path
- Set appropriate lookback windows based on your sales cycle length
- Create segment comparisons based on source, device, or user characteristics
- Save reports for continued historical tracking and trend analysis
5. Implement Advanced Analysis with BigQuery Export
How can we preserve and analyze our raw event data for sophisticated predictive modeling?
For enterprise-level historical data management, link GA4 to BigQuery:
- Enable BigQuery Export in your GA4 property settings
- Create a BigQuery dataset to receive the daily event data
- Develop SQL queries to analyze funnel performance over time
- Build custom retention models based on historical progression patterns
- Perform advanced statistical analysis to identify predictive indicators
Sample BigQuery SQL:
sql
-- Analysis of conversion rates by channel and week
SELECT
  traffic_source.source AS channel,
  FORMAT_DATE('%Y-%W', PARSE_DATE('%Y%m%d', event_date)) AS week,
  COUNT(DISTINCT user_pseudo_id) AS users,
  SUM(CASE WHEN event_name = 'demo_requested' THEN 1 ELSE 0 END) AS conversions,
  SAFE_DIVIDE(
    SUM(CASE WHEN event_name = 'demo_requested' THEN 1 ELSE 0 END),
    COUNT(DISTINCT user_pseudo_id)
  ) AS conversion_rate
FROM
  `your-project.analytics_123456789.events_*`
WHERE
  _TABLE_SUFFIX BETWEEN '20220101' AND '20230101'
GROUP BY
  channel, week
ORDER BY
  channel, week
6. Set Up Rolling Time Comparisons
How can we establish benchmarks and measure performance changes over time?
Use GA4's comparison features to analyze trends in your historical data:
- Create time-based comparisons (current period vs. previous period)
- Establish year-over-year analyses for seasonal pattern detection
- Set up custom period comparisons for campaign or initiative evaluation
- Monitor progress against historical benchmarks
GA4 Interface Steps:
- In any report, click the "Add Comparison" button
- Select "Time" as the dimension
- Choose appropriate timeframes (previous period, year, custom)
- Apply to see trended performance data
7. Build Custom Insights Dashboards
How can we make historical funnel data accessible and actionable for stakeholders?
Create purpose-built dashboards that highlight key funnel metrics:
- Use the Reports > Dashboards feature to build custom views
- Include scorecards for top-level KPIs with period-over-period comparisons
- Add funnel visualizations showing stage-by-stage conversion rates
- Incorporate segment comparisons to highlight highest-performing channels
- Display trend charts showing how key metrics evolve over time
Dashboard Elements to Include:
- Entrance rate by channel (top of funnel)
- Content engagement rates (mid-funnel)
- Conversion rates by segment (bottom of funnel)
- Average time to conversion (velocity)
- Return visitor conversion rates (nurture effectiveness)
8. Implement Predictive Metrics
How can we leverage historical patterns to forecast future performance?
Use GA4's machine learning capabilities to develop predictive insights:
- Enable predictive metrics in your property settings
- Set up purchase probability and churn probability audiences
- Create segments based on predicted behaviors
- Use these predictions to optimize marketing spend and targeting
GA4 Interface Steps:
- Go to Configure > Audiences
- Create a new audience
- Select "Predictive" conditions
- Choose metrics like "Purchase probability" or "Churn probability"
- Set appropriate thresholds based on your business goals
Overcoming GA4 Limitations for Complete Funnel Analysis
While GA4 provides powerful tools for collecting historical funnel data, it has limitations in connecting pre-conversion behavior to post-sale outcomes. To address this:
- Use Google signals and User-ID features to maintain identity across devices and sessions
- Implement offline conversion imports to connect online behavior to offline sales
- Create a measurement protocol implementation to pass CRM data back to GA4
- Develop a customer data platform integration to unify pre and post-conversion data
- Establish a data warehouse strategy combining GA4, CRM, and other data sources
Moving from Data to Empathy: The Transformative Power of Journey Mapping
When you connect these technical implementations to a deep understanding of your buyer's emotional journey, you create something transcendent: a digital experience that feels less like marketing automation and more like mind-reading.
The data you collect isn't just numbers - it's the digital footprints of human beings in various emotional states:
- The curious but skeptical prospect researching alternatives
- The convinced buyer seeking reassurance before committing
- The enthusiastic champion gathering ammunition to persuade internal stakeholders
By mapping content precisely to these emotional states and measuring the effectiveness of each touchpoint, you don't just optimize a funnel—you create authentic human connections at scale.
This is the true competitive advantage that no competitor can easily replicate: building a website experience that doesn't just convert visitors but transforms them from passive browsers to passionate advocates by meeting them exactly where they are on their journey, with exactly what they need, at exactly the right moment.
When data meets empathy, magic happens.
By implementing these strategies, you'll build a comprehensive historical funnel that enables accurate performance modeling, trend analysis, and predictive forecasting—transforming your marketing strategy from reactive to proactive, from guesswork to data-driven decision making, and most importantly, from transactional to genuinely transformational.